🔹 Step 1: Identify Timeframe
- Decide cheyyi short-term (15min / 1hr / daily) or long-term (weekly / monthly) analysis cheyyalani.
- Example: Intraday trader ki 15min–1hr chart useful, investor ki weekly–monthly chart important.
🔹 Step 2: Understand Trend
- Trendline draw cheyyi.
- Types of trends:
- 📈 Uptrend → Higher Highs, Higher Lows
- 📉 Downtrend → Lower Highs, Lower Lows
- 🔀 Sideways → Price range lo move avtundi
🔹 Step 3: Mark Support & Resistance
- Support: Price repeatedly bounce ayyina level (buyers entry).
- Resistance: Price repeatedly reject ayyina level (sellers entry).
- Ivi future price action ki decision points.
🔹 Step 4: Use Indicators
- RSI (Relative Strength Index) → Overbought (>70), Oversold (<30).
- MACD (Moving Average Convergence Divergence) → Trend strength & momentum.
- Moving Averages (20, 50, 200 EMA) → Short & long-term direction.
- Volume → Price move ki strength confirm chestundi.
🔹 Step 5: Candlestick Patterns Observe Cheyyi
- Doji → Market indecision
- Hammer → Reversal indication (at support)
- Shooting Star → Reversal indication (at resistance)
- Engulfing Patterns → Strong reversal signal
🔹 Step 6: Risk Management
- Always Stop Loss petti enter avvali.
- Position sizing maintain cheyyali → One trade lo big risk theesukovaddu.
🔹 Step 7: Combine All & Write Conclusion
- Trend + Support/Resistance + Indicators ni combine chesi clear outlook rayi.
- Example:
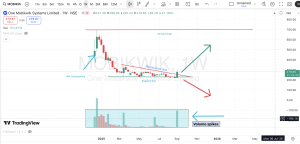
- “Mobikwik stock currently trading near strong support at ₹250. RSI is in oversold zone, indicating possible bounce. But if it breaks ₹245, next support lies near ₹220.”
📝 Disclaimer:
“This procedure is for educational purposes only, not financial advice. Always do your own research or consult a SEBI-registered advisor.”